I have added an air quality monitor to my weather station (see below). The sensor I am using is the Plantower PMS5003 sensor and I have used a Raspberry Pi to capture and process the data and upload xml files to the internet to display the recorded data on my website. The software is based on that produced by https://www.rigacci.org but I have adapted it to display current and historical information on my website. I am also uploading the information to Weather Underground (Wunderground), although at present, Wunderground does not seem to display this data nor make it available for historical analysis.
The information I am recording is 'Particulate Matter' PM1.0, PM2.5 and PM10. These are particles with a diameter of 1.0μm or less, 1.0μm to 2.5μm and 2.5μm to 10μm respectively. The latter two are measured for air quality monitoring. The differences between these are as follows:
The measurements recorded are in μg/m3. On my website I give the current reading and the highest reading recorded during the day. Additionally, I calculate the Air Quality Index (AQI) for each type of particle. Around the world different methods are used for defining AQI; I use that defined by Environment NSW. Note that the AQI measurements record the mass of particles below 2.5μm and below 10μm respectively. Therefore for the PM2.5 AQI reading I am including the readings for 1.0μm and 2.5μm; for the PM10 AQI I am including all 3 readings.
Different states and countries set different thresholds for acceptable levels of the particulates. In NSW, the safe levels are as follows:
| PM2.5 | PM10 | |
| 24 hour average | 25 μg/m3 | 50 μg/m3 |
| Annual average | 8 μg/m3 | 25 μg/m3 |
The AQI is calculated using the 24 hour average value equating to an AQI of 100. The following table, again from Environment NSW defines the action to be taken depending on the recorded AQI.
| Here is the air quality sensor I used - the PMS5003. These are readily available on eBay for about $30. | 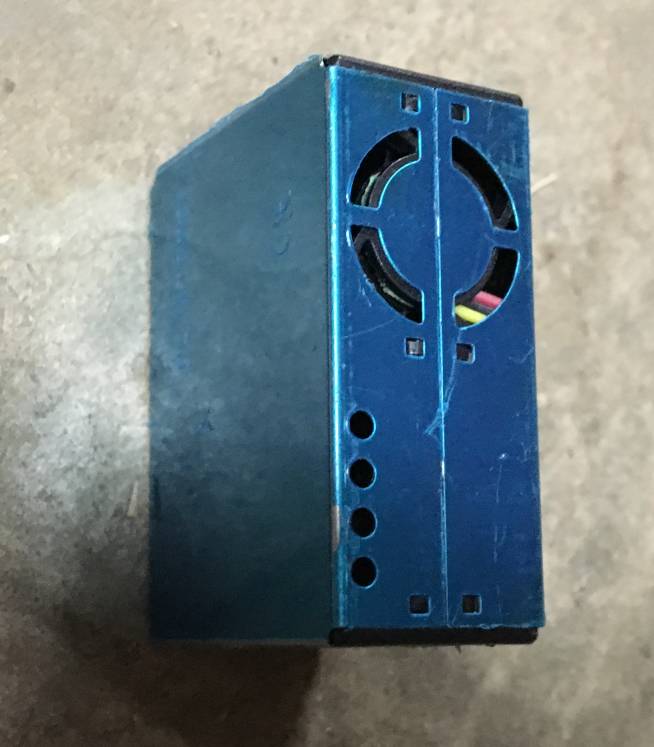 |
| I used a Raspberry Pi in a weatherproof housing (from Jaycar electronics - but available from many suppliers) to connect to the sensor and transmit the information via WiFi. I bought a rain cowl from Bunnings to go over the air sensor but still allow the air to be measured (see image on the main page). | 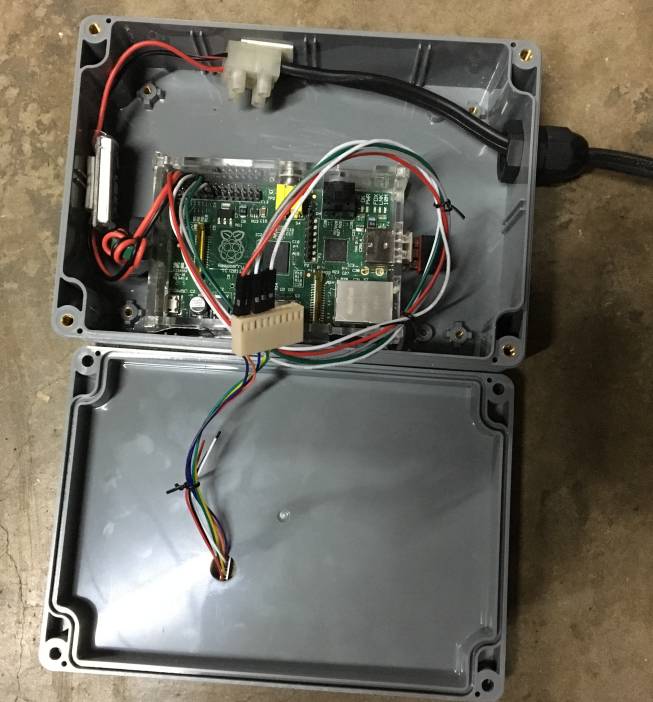 |
For further information, the following links may be useful:
http://www.environment.nsw.gov.au/AQMS/aqi.htm
https://en.wikipedia.org/wiki/Particulates
http://www.epa.vic.gov.au/your-environment/air
https://www.epa.gov/pm-pollution/particulate-matter-pm-basics
If you have any comments, or want any information, please send me an email at steve@tijou.co.uk.
This page was last updated 5 February 2018.
Click here to go to the main weather page.